Інформація призначена тільки для фахівців сфери охорони здоров'я, осіб,
які мають вищу або середню спеціальну медичну освіту.

Підтвердіть, що Ви є фахівцем у сфері охорони здоров'я.

Журнал «Боль. Суставы. Позвоночник» Том 15, №1, 2025

Вернуться к номеру

Визначення індексу ризику переломів Колліса на основі рентгенівських знімків за допомогою програми комп’ютерної оцінки

Авторы: Wisam A. Hussein, Hussain J. AlKhatteib, Jawad K. Abbas
University of Kufa, Najaf, Iraq

Рубрики: Ревматология, Травматология и ортопедия

Разделы: Клинические исследования

Версия для печати


Резюме

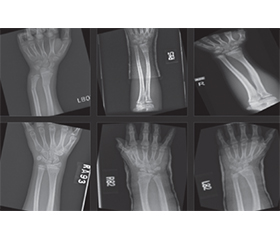
Актуальність. Моделювання прогностичного індексу ризику переломів Колліса за допомогою аналізу рентгенівських зображень є вирішальним при застосуванні в ортопедії, оскільки переломи цієї локалізації мають суттєвий тягар для здоров’я та економіки, особливо в осіб літнього віку. Попередні дослідження встановили зв’язок між зниженням мінеральної щільності кісткової тканини та підвищеним ризиком переломів цієї локалізації. Мета дослідження: оцінка комп’ютерної моделі для прогнозування ризику виникнення переломів Колліса при будь-якому падінні або фізичному навантаженні на зап’ясток. Матеріали та методи. Ця модель отримана шляхом аналізу кількісних характеристик рентгенівських зображень передпліччя. Прогностична модель була створена розробником проєкту AIT з використанням Python 3.12, PHP і JS, html. Модель AIT233 була застована згідно з некомерційною ліцензією на наукові дослідження. Рентгенівські знімки передпліччя здорових осіб (без переломів, контрольна група) і осіб з переломами Колліса були завантажені з ліцензованого репозиторію. Із застосуванням методів порогового визначення зображення, нормалізації та реєстрації було отримано та проаналізовано знімки кісток за допомогою алгоритмів комп’ютерної оцінки. Результати. Порівняльний аналіз інтенсивності зображення передпліччя в осіб контрольної групи та пацієнтів з переломами Колліса дав відносний індекс інтенсивності кісток 1,09 (82 ± 5 проти 75 ± 6 пікселів відповідно). Результати виявили статистично значущі відмінності між групами (p < 0,05), що свідчить про те, що інтенсивність зображення є потенційним предиктором ризику переломів. Розрахований показник ризику на основі інтенсивності зображення продемонстрував позитивний зв’язок із виникненням переломів Колліса. ­Висновок. Отримані нами результати є основою для розробки надійного інструменту прогнозування, який може допомогти в профілактиці та лікуванні хворих з переломом Колліса.

Background. Modelling a predictive risk index for Colles fractures using X-ray image analysis is a crucial application in orthopaedics since these fractures have essential health and economic burdens, particularly among the elderly. Previous research has established a correlation between decreased bone mineral density and the elevated risk of these fractures. This study purposed to assess a computer vision model for predicting the risk of Colles fractures occurrence upon any fall or physical stress on the wrist. Materials and methods. This model was obtained by analyzing quantitative characteristics extracted from forearm X-ray images. A predictive model was designed by the AIT project developer using Python 3.12, PHP and JS, html. The use of the AIT233 model was granted for this study under a non-profit scientific research license. Forearm X-ray datasets for the normal (without fracture, control group) and Colles fracture individuals were downloaded from a licensed repository. By implementing image thresholding, normalization and registration techniques, validated bone images were obtained and analyzed using computer vision algorithms. Results. A comparative analysis of forearm image intensity between subjects from the control group and patients with Colles fractures resulted in a 1.09 relative index of bone intensity (mean 82 ± 5 vs. 75 ± 6 pixels, respectively). The results showed statistically significant differences (p < 0.05), suggesting that image intensity is a potential predictor of fracture risk. A calculated risk score based on image intensity demonstrated a positive association with the occurrence of Colles fracture. Conclusions. The results provide the basis for developing a robust predictive tool that can aid in the prevention and management of Colles fractures.


Ключевые слова

перелом Колліса; індекс ризику; методи порогової обробки; рентгендослідження

Colles fracture; risk index; thresholding; Х-ray

Introduction

Colles fracture is a common type of distal fracture of the radius bone. It showed a high incidence and morbidity. Trials to predict the risk of Colles fracture are essential for prevention. Advanced image processing and computer vision technologies enabled the design of a predictive model for normalizing and measuring forearm bone image intensity [1]. One study in Sweden showed that the yearly incidence of Colles fracture was 0.002, which is higher among women. The economic burden and impact on quality of life associated with Colles fracture increase its importance and necessitate designing an accurate predictive index [2].
The relationship between bone density and health, in association with bone image intensity, can be considered a relation between decreased bone mineral density and the increased risk of fractures like Colles fracture [3–5]. A meta-analysis study revealed that decreased bone mineral density is a significant risk factor for osteoporotic fractures and was associated with a 1.6-fold amplified risk of Colles fracture [6].
Bone image intensity techniques like dual-energy X-ray absorptiometry or quantitative computed tomography are associated with measuring bone mineral content and density, and they are also used to predict fracture risk. Advances in computer vision and artificial intelligence technologies have opened new possibilities for developing predictive models for Colles fracture. These techniques can analyze forearm bone images and extract associated features that may indicate fracture risk [7–9]. The researchers can achieve validated bone images and analysis using computer vision algorithms by implementing image thresholding normalisation and registration techniques. Machine learning models can be trained on these image features to predict the risk of Colles fracture [10–12].
The implementation of image processing and artificial intelligence techniques in clinical practice will increase orthopaedic specialists’ accuracy in risk assessments for Colles fractures, which will improve patient outcomes and design preventive plans [13, 14].
This study aimed to develop a computer vision algorithm-based model for predicting the risk of Colles fractures upon any fall or physical stress on the wrist.
Methodology

Models and datasets

The dataset for this study was obtained from the Kaggle repository and consisted of two groups of X-ray images. The Colles fracture (320 images) and unbroken forearm (270 images, the control group) were under general license. The images were organized into separate subfolders for the control group and Colles fracture groups.
Image preprocessing
AIT233 is a non-profit computer vision app designed and developed specifically for this study by the developer who provided a general license to use this app for scientific purposes. The application uses image processing and registration to assess the possibility of Colles fractures occurring due to stress on the wrist joints. AIT233 is built using JavaScript, and a desktop version, AIT233.exe, was created under the MIT license, which the author granted for research purposes.
Forearm X-ray datasets, including images from individuals from the control group and those with Colles fractures, were obtained from a licensed repository of Kaggle. The AIT233 model preprocesses these X-ray images through the following steps: image acquisition, preprocessing feature extraction, registration, and prediction.
1. Background and exposure unbiases by thresholding
The background and exposure of the X-ray images were corrected using a thresholding technique to ensure consistent image quality.
Thresholding. This technique separates the foreground bone pixels from the background non-bone pixels based on their grayscale intensity values. The threshold value can be determined using various methods, such as the Otsu method, which finds the optimal threshold that minimizes the intra-class variance of the foreground and background pixel [15].
a) Otsu method formula
Threshold = arg max_t (σ_b^2(t)/(σ_f^2(t) + σ_b^2(t))),
where σ_f^2 and σ_b^2 are the variances of the foreground and background pixels, respectively.
b) Adaptive Thresholding
This technique adjusts the threshold value locally based on the image’s characteristics. One common approach is the Sauvola method, which calculates the threshold [16].
Sauvola method formula
Threshold(x, y) = m(x, y) × (1 + k • ((s(x, y)/R) – 1)),
where m(x, y) is the mean grayscale value, s(x, y) is the standard deviation of the grayscale values, R is the dynamic range of the standard deviation (typically 128), and k is a constant (typically 0.5).
c) Histogram Equalization
This technique distributes the grayscale intensity values in the image to enhance the contrast between the bone and the background. The new pixel value Int can be calculated [17].
d) Histogram Equalization formula
Int = (L – 1) × (cumulative histogram(I_old)/total pixels),
where L is the number of grayscale levels (typically 256), and I_old is the original pixel value.
2. Normalization of X-ray image sizes
After positional calibration of forearm orientations, all X-ray images were resized to a uniform size to enable accurate comparison and analysis. This process ensures that the image size and pixel dimensions are consistent across all the X-ray images. You can achieve this by resizing all the images to a standard size using an interpolation method, such as bilinear or bicubic interpolation [18].
a) Bilinear Interpolation formula
I(x, y) = (1 – x)(1 – y)I(x1, y1) + x(1 – y)I(x2, y1) + (1 – x)yI(x1, y2) + xyI(x2, y2),
where (x, y) is the target pixel location, (x1, y1) and (x2, y2) are the surrounding pixel locations, and I(x, y) is the interpolated pixel value.
b) Pixel Scaling
After normalizing the image size, the pixel intensities are scaled to a standard range such as [0, 1] or [0, 255] using the following formula [18].
c) Pixel Scaling formula 
Int = (old – min) / (max – min) × (newMax – newMin) + newMin,
where old is the original pixel value, min and max are the minimum and maximum values in the original image, and newMin and newMax are the desired minimum and maximum values of the scaled image [19].
3. Image registration
The X-ray images were registered to a standard reference frame to account for potential variations in patient positioning and image orientation.
Segmentation. This technique involves separating the bone region from the rest of the image, using techniques like edge detection region growing or active contours to outline the bone region accurately [20].
a) Edge Detection formula
G = sqrt(Gx^2 + Gy^2), 
where Gx and Gy are the gradients in the x and y directions, respectively.
b) Region Growing formula
Rnew = Rold + {p | p ∈ N(R_old) and T(p) ≤ t),
where Rnew is the new region, Rold is the current region, N(R_old) are the neighboring pixels of the current region and T(p) is a similarity measure that satisfies the threshold t.
Morphological operations. These operations, such as erosion dilation opening and closing, can be used to further refine the segmentation of the bone region and remove any remaining non-bone pixels [21].
c) Erosion formula
E(x, y) = min_{(u, v) ∈ B} I(x + u, y + v),
where E(x, y) is the eroded pixel value, I(x, y) is the original pixel value, and B is the structuring element.
d) Image Registration
If the bone position or orientation varies across the X-ray images, you can use image registration techniques to align the bone region across all the images. This ensures that the bone density analysis is performed on the same anatomical region, regardless of the original image orientation or positioning [22].
e) Affine Transformation formula
[x’, y’] = [a11 a12 | a21 a22] × [x, y] + [tx, ty],
where [x, y] are the original coordinates, [x’, y’] are the transformed coordinates and a11 a12, a21 a22, tx and ty are the affine transformation parameters.
4. Forearm image intensity calculation
The intensity values of the forearm region in each X-ray image were calculated to quantify the image characteristics.
5. Statistical comparison of colles fracture and normal image intensities
The distributions of forearm image intensities were compared between the Colles fracture and subjects from the control group using appropriate statistical tests to identify significant differences.
6. Predictive score determination
Based on the statistical analysis, a predictive score was calculated to quantify the likelihood of a given X-ray image belonging to the subjects with Colles fracture or the control group.
7. Validation and evaluation
The predictive model’s performance was evaluated using appropriate validation techniques, such as cross-validation or holdout testing. Relevant metrics, including accuracy, precision-recall, and area under the curve, were reported to assess the model’s effectiveness in distinguishing between Colles fracture and X-ray images from the subjects of control group.
Ethical requirements. Radiology data were secondary and distributed on the Kaggle repository as datasets for free use in research. The computer vision app was also freely granted to researchers, as clarified in the references.
Statistical methods
Image registration statistics. The statistical methods and metrics used to evaluate registration processes included the Mutual Information (MI) coefficient Root Mean Square Error (RMSE) and prediction performance metrics. Key statistical measures such as sensitivity, specificity, and precision are also considered.
Applicable statistical tests used. Background analysis. The test of Kolmogorov-Smirnov was used to assess the intensity distribution across datasets. Test of Mann-Whitney U Test was used to compare the effectiveness of different thresholds.
Tests for image normalization. A paired t-test was used to compare pre- and post-normalization findings. The Intraclass Correlation Coefficient was also used to evaluate the reliability and consistency of results.

Results

The findings were arranged in alignment with the methods of preprocessing the radiological images, starting with all computer vision-based thresholding, normalization, and registration of the X-ray film dataset of healthy wrist joints, as described in Fig. 2, and then the second montage of radiological film preprocessing for patients with Colles fractures, as described in Fig. 3.
Fig. 2 illustrates a montage of X-ray images from healthy individuals processed to remove background and exposure intensity biases using a thresholding technique.
The background removal method isolates bone structures by separating foreground bone pixels from non-bone background pixels based on grayscale intensity values. The threshold value determined using the Otsu method ensured optimal segmentation by minimizing intra-class variance between foreground and background. This preprocessing step standardized image quality and enhances contrast, ensuring precise and consistent evaluation of bone structures (Fig. 3).
Fig. 4 presents an analysis highlighting the comparative intensities of forearm X-ray images between two distinct groups: individuals from the control group and patients with Colles fractures.
The mean intensity for the subjects from the control group was recorded at 82 ± 5 pixels (8 bits), while patients with Colles fractures exhibited a lower mean intensity of 75 ± 6 pixels. This differential in X-ray intensity serves as a potential primary predictor index for identifying the risk of Colles fractures, particularly in scenarios involving falls. The findings suggest a reversal in the association between fracture occurrence and bone intensity, which means that lower intensity values may correlate with an increased likelihood of fracture. This insight can augment clinical assessments and preventive strategies in managing bone health and mitigating fracture risks in susceptible populations.

Discussion

The present study was designed to develop a predictive model for anticipating Colles fractures by analyzing X-ray image features. The primary finding of this study revealed statistically significant differences in forearm image intensity between the Colles fracture group and the control group (p < 0.05). This suggests that image intensity as a feature can be a diagnostic marker for differentiating between healthy individuals and those at risk of Colles fractures [23]. The observed disparity in mean forearm image intensity of 82 ± 5 pixels (8-bit scale) in the control group compared to 75 ± 6 pixels in the Colles fracture group underscores the potential utility of this metric in clinical diagnostics. The calculated risk score of 1.09 indicated that individuals with lower forearm image intensity may have a higher probability of sustaining a Colles fracture. This finding is in agreement with the established pathophysiology of Colles fractures that was associated with reduced bone mineral density (BMD) and increased bone resorption predispose individuals to fractures upon trauma [24].
The predictive model developed in this study used differences in forearm image intensity as a key variable, offering a potential screening tool for the early identification of individuals at risk of Colles fractures. Early detection is critical, as it enables the implementation of prophylactic measures, such as targeted bone health monitoring, lifestyle modifications, and pharmacological interventions, to mitigate the risk of wrist injuries. For instance, individuals identified as high-risk could benefit from calcium and vitamin D supplementation exercises or bisphosphonate therapy to improve bone density and reduce fracture risk [25]. This approach not only has the potential to reduce the incidence of Colles fractures but also to alleviate the associated healthcare costs, including hospitalization and rehabilitation expenses.
These results must be explained with caution due to several limitations. The small sample size and restricted dataset license may limit the generalizability of the findings. Predictive models are susceptible to the quality and diversity of the data used for training, and limited datasets may result in overfitting or errors. The performance of the model may be influenced by external factors such as variations in image quality, patient positioning during X-rays, and the specific imaging equipment used. The differences in X-ray machine calibration exposure or image resolution could introduce variability in image intensity measurements that affect the model’s reliability [26, 27].
Studies focusing on expanding the dataset to include a more diverse and representative sample can enhance the model’s robustness and generalizability across different demographic groups and clinical settings. They could also refine image preprocessing and analysis techniques to improve the predictive model’s accuracy and reliability. Advanced image processing algorithms, such as deep learning-based segmentation and feature extraction, can be used to reduce noise in X-ray images [28, 29].
Longitudinal studies are beneficial in validating the model’s clinical utility. By monitoring individuals over time and correlating the model predictions with actual Colles fracture incidence, researchers can assess the model’s predictive accuracy in real-world scenarios. Such studies could also explore the integration of additional variables, such as patient age, gender, medical history, and lifestyle factors, to improve the model’s predictive capability. For example, incorporating data on osteoporosis prevalence, physical activity levels, and dietary habits could provide a more comprehensive risk assessment framework [30, 31].
The integration of this predictive model into clinical practice could be facilitated by the development of user-friendly software tools that automate the analysis of X-ray images and generate risk scores in real-time. Such tools could be integrated into existing radiology workflows, enabling clinicians to identify high-risk patients during routine imaging examinations. This will accelerate the diagnostic process and also ensure that individuals at risk will receive suitable interventions to prevent fractures [32]. Different IT and AI-based technologies can augment the capabilities of predicting any orthopaedic disorder by machine learning mechanisms that can increase the quality and quantity of the outcomes of any radiological imaging. Such technologies require already validated datasets and methods of image processing, so AIT233 was an example of such integrative techniques that can support AI algorithms to process and analyze bone radiology.
This study has limitations, such as the dataset and the potential need for more validations with a larger or more different dataset.

Conclusions

The findings of this study suggest that analyzing forearm image intensity can provide promising indicators of the detection of Colles fractures. If validated, the proposed predictive model can ensure a practical tool to assist clinicians in the early detection and management of individuals at risk of this common wrist injury.
 
Received 01.01.2025
Revised 04.02.2025
Accepted 19.02.2025

Список литературы

  1. Obermeyer Z, Emanuel EJ. Predicting the Future — Big Data, Machine Learning, and Clinical Medicine. N Engl J Med. 2016 Sep 29;375(13):1216-1219. doi: 10.1056/NEJMp1606181.
  2. Brogren E, Petranek M, Atroshi I. Incidence and characteristics of distal radius fractures in a southern Swe–dish region. BMC Musculoskelet Disord. 2007 May 31;8:48. doi: 10.1186/1471-2474-8-48. 
  3. Çiçek Ö, Abdulkadir A, Lienkamp SS, Brox T, Ronneberger O. 3D U-Net: Learning dense volumetric segmentation from sparse annotation. In: Ourselin S, Joskowicz L, Sabuncu M, Unal G, Wells W, editors. Medical Image Computing and Computer-Assisted Intervention — –MICCAI 2016. Series: Lecture Notes in Computer Science, vol. 9901. Cham: Springer; 2016. 424-432 pp. doi: 10.1007/978-3-319-46723-8_49.
  4. Engelke K, Libanati C, Fuerst T, Zysset P, Genant HK. Advanced CT based in vivo methods for the assessment of bone density, structure, and strength. Curr Osteoporos Rep. 2013 Sep;11(3):246-255. doi: 10.1007/s11914-013-0147-2.
  5. Litjens G, Kooi T, Bejnordi BE, et al. A survey on deep learning in medical image analysis. Med Image Anal. 2017 Dec;42:60-88. doi: 10.1016/j.media.2017.07.005.
  6. Kanis JA, Harvey NC, Johansson H, Odén A, Leslie WD, McCloskey EV. FRAX and fracture prediction without bone mineral density. Climacteric. 2015;18(Suppl 2):2-9. doi: 10.3109/13697137.2015.1092342. 
  7. Kanis JA, Johansson H, Oden A, McCloskey EV. Assessment of fracture risk. Eur J Radiol. 2009 Sep;71(3):392-397. doi: 10.1016/j.ejrad.2008.04.061. 
  8. Kapur JN, Sahoo PK, Wong AKC. A new –method for gray-level picture thresholding using the entropy of the histogram. Comput Vis Graph Image Process. 1985 Mar;29(3):273-285. doi: 10.1016/0734-189X(85)90125-2.
  9. Hassanabadi N, Berger C, Papaioannou A, et al. Variation in bone mineral density and fractures over 20 years among Canadians: a comparison of the Canadian Multicenter Osteoporosis Study and the Canadian Longitudinal Study on Aging. Osteoporos Int. 2023 Feb;34(2):357-367. doi: 10.1007/s00198-022-06623-4.
  10. Sahoo PK, Soltani S, Wong AKC, Chen YC. A survey of thresholding techniques. Comput Vision Graph Image Process. 1988;41(2):233-260. doi: 10.1016/0734-189X(88)90022-9.
  11. Liu H, Durongbhan P, Davey CE, Stok KS. –Ima–ge Registration in Longitudinal Bone Assessment –Using Computed Tomography. Curr Osteoporos Rep. 2023 Aug;21(4):372-385. doi: 10.1007/s11914-023-00795-6.
  12. Ronneberger O, Fischer P, Brox T. U-net: Convolutional networks for biomedical image segmentation. In: Navab N, Hornegger J, Wells W, Frangi A, editors. Medical Image Computing and Computer-Assisted Intervention — MICCAI 2015. Series: Lecture Notes in Computer Science, vol. 9351. Cham: Springer; 2015. 234-241 pp. doi: 10.1007/978-3-319-24574-4_28.
  13. Kanis JA, Harvey NC, McCloskey E, et al. Algorithm for the management of patients at low, high and very high risk of osteoporotic fractures. Osteoporos Int. 2020 Jan;31(1):1-12. doi: 10.1007/s00198-019-05176-3.
  14. Sotiras A, Davatzikos C, Paragios N. Defor–mable medical image registration: A survey. IEEE Trans Med Imaging. 2013;32(7):1153-1190. doi: 10.1109/TMI.2013.2265603.
  15. Darzi F, Bocklitz T. A Review of Medical –Image Registration for Different Modalities. Bioengineering (Basel). 2024 Aug 2;11(8):786. doi: 10.3390/bioengine–ering11080786.
  16. Sauvola J, Pietikäinen M. Adaptive document image binarization. Pattern Recognit. 2000;33(2):225-236. doi: 10.1016/S0031-3203(99)00055-2.
  17. Gonzalez RC, Woods RE. Digital Image Processing. 4th ed. New York: Pearson; 2018. 
  18. Tibshirani R, Walther G, Hastie T. Estimating the number of clusters in a dataset via the gap statistic. Journal of the Royal Statistical Society: Series B (Statistical Methodology). 2001;63(2):411-423. doi: 10.1111/1467-9868.00293. 
  19. Russ JC, Neal FB. The Image Processing Handbook. 7th ed. Boca Raton, FL: CRC Press; 2016. 1053 p. doi: 10.1201/b18983.
  20. Sonka M, Hlavac V, Boyle R. Image Processing, Analysis, and Machine Vision. 4th ed. Boston, MA: Cengage Learning; 2014. 920 p. 
  21. Haralick RM, Sternberg SR, Zhuang X. Image ana–lysis using mathematical morphology. IEEE Trans Pattern Anal Mach Intell. 1987 Apr;9(4):532-550. doi: 10.1109/tpami.1987.4767941. 
  22. Zitová B, Flusser J. Image registration methods: A survey. Image Vis Comput. 2003;21(11):977-1000. doi: 10.1016/S0262-8856(03)00137-9.
  23. Xu H, Xue T, Fan J, et al. Medical Image Registration Meets Vision Foundation Model: Prototype Learning and Contour Awareness. arXiv. 2025 Feb:2502.11440v1[cs CV]. doi: 10.48550/arXiv.2502.11440.
  24. Kanis JA, Cooper C, Rizzoli R, Reginster JY; Scientific Advisory Board of the European Society for Clinical and Economic Aspects of Osteoporosis (ESCEO) and the Committees of Scientific Advisors and National Societies of the International Osteoporosis Foundation (IOF). European guidance for the diagnosis and management of osteoporosis in postmenopausal women. Osteoporos Int. 2019 Jan;30(1):3-44. doi: 10.1007/s00198-018-4704-5. 
  25. Cosman F, de Beur SJ, LeBoff MS, et al.; National Osteoporosis Foundation. Clinician’s Guide to Prevention and Treatment of Osteoporosis. Osteoporos Int. 2014 Oct;25(10):2359-2381. doi: 10.1007/s00198-014-2794-2.
  26. Baines AJ, Babazadeh-Naseri A, Dunbar NJ, Le–wis VO, Fregly BJ. Bilateral asymmetry of bone density adjacent to pelvic sarcomas: A retrospective study using computed tomography. J Orthop Res. 2022 Mar;40(3):644-653. doi: 10.1002/jor.25067.
  27. Tsai PH, Wong CC, Chan WP. Radial T2 mapping reveals early meniscal abnormalities in patients with knee osteoarthritis. Eur Radiol. 2022 Aug;32(8):5642-5649. doi: 10.1007/s00330-022-08641-6.
  28. Karimi D, Zeng Q, Mathur P, et al. Accurate and robust deep learning-based segmentation of the prostate clinical target volume in ultrasound images. Med Image Anal. 2019 Oct;57:186-196. doi: 10.1016/j.media.2019.07.005.
  29. Matharu GS, Judge A, Murray DW, Pandit HG. Prevalence of and Risk Factors for Hip Resurfacing Revision: A Cohort Study іnto the Second Decade After the Operation. J Bone Joint Surg Am. 2016 Sep 7;98(17):1444-1452. doi: 10.2106/JBJS.15.01234.
  30. Cummings SR, Melton LJ. Epidemiology and outcomes of osteoporotic fractures. Lancet. 2002 May 18;359(9319):1761-1767. doi: 10.1016/S0140-6736(02)08657-9.
  31. Sözen T, Özışık L, Başaran NÇ. An overview and management of osteoporosis. Eur J Rheumatol. 2017 Mar;4(1):46-56. doi: 10.5152/eurjrheum.2016.048. 
  32. Colles Fracture Predictor. Available from: https://ait-sciences.com/wp-content/uploads/2025/02/FracturePredictor17-4.html.

Вернуться к номеру